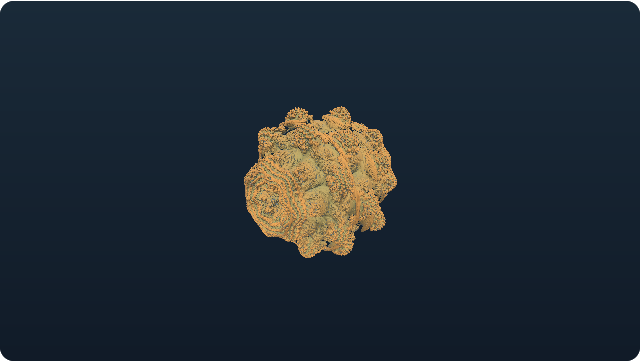
What Is Volume Shader BM?
Volume Shader BM is a browser GPU benchmark built around an original Mandelbulb shader. BM means benchmark: a repeatable procedure for observing performance under specified conditions. You may also see the name written as volumeshader bm or volumeshader_bm. Here those names refer to a single tool with its own workload and protocol versions.
Use this GPU shader test to explore the cost of fractal detail, check changes after a browser update, or repeat a fixed scene on another device. It produces measured frame intervals rather than a universal graphics score. Results do not share a scale with similarly named tools on other websites.
How to Run the Volume Shader BM Test
Begin in Explore / Stress with Ultra Low or Low. Save other work, leave this tab visible, and press Start Test. The renderer initializes, warms up for three seconds, then collects intervals. No fractal rendering or timing collection takes place before your explicit start. Stop Test remains available during loading, warm-up and measurement.
Explore slowly orbits the fractal after Start. Turn Auto-rotate off to hold an angle while FPS sampling continues. Drag with a mouse or touch to turn the view; dragging pauses automatic rotation. Focus the viewport and use arrow keys, or use the direction buttons. Space toggles rotation, and Reset view returns to the starting angle. Reduced-motion preferences default rotation to paused.
Wait for completion or stop early to inspect a partial result. Change workload settings between runs, then start again. Hiding the page, resizing the viewport or losing the graphics context ends the session instead of resuming across a timing gap. If rendering fails, reduce the preset or try another browser; the instructions remain readable.
How the Mandelbulb Shader Works
The Mandelbulb is a three-dimensional fractal formed by repeatedly transforming a point with a spherical power operation. This implementation uses power eight. A distance estimator approximates the distance to its surface. For each framebuffer pixel, the fragment shader follows a camera ray through a bounding sphere, advancing with that estimate until it approaches the surface or reaches a bound.
This is commonly called volume ray marching, although this scene shades an estimated surface rather than integrating physical fog density. Neighboring estimates provide a surface normal for directional lighting. An orbit-based color value reveals structure. Explore moves the camera around the fractal while light direction remains fixed. Standard Benchmark fixes camera, lighting and phase to preserve its repeatable workload.
Choose a Preset and Adjust GPU Workload
Kernel Iterations limits the repeated Mandelbulb calculation within one distance evaluation. Ray March Max Steps limits evaluations along the camera ray. Step Scale multiplies the estimated distance when advancing; it is not a fixed physical distance. A smaller multiplier usually needs more evaluations to reach the surface. Resolution Scale changes requested framebuffer size.
Explore starts at Low on typical desktops and Ultra Low for narrow viewports, coarse pointers, or limited reported CPU or memory capacity. Resolution uses viewport width × device pixel ratio × scale, with DPR capped at two. Width rounds down to a multiple of sixteen for an exact 16:9 scene. Desktop caps at 1280 × 720; conservative devices cap at 640 × 360 and sixty seconds. The panel displays chosen scale and effective dimensions.
Harder presets normally add work, but compiler optimizations and early ray exits prevent guaranteed timing order. Extreme and equivalent advanced settings require the higher-load checkbox. Workload settings lock during each run; Explore camera controls remain available. View changes alter visible surfaces and ray costs, so an Explore result never inherits a Standard label.
| Preset | Kernel iterations | Max steps | Step scale | Resolution scale |
|---|---|---|---|---|
| Ultra Low | 4 | 32 | 0.9 | 0.5 |
| Low | 5 | 48 | 0.85 | 0.65 |
| Balanced | 7 | 80 | 0.8 | 0.75 |
| High | 9 | 120 | 0.7 | 1 |
| Extreme | 12 | 192 | 0.6 | 1 |
Understanding FPS and Frame-Time Results
Average FPS equals valid interval count divided by accumulated duration in seconds. Mean frame time is that duration divided by interval count. Sixteen-to-seventeen milliseconds per interval is roughly sixty frames per second. The median describes the midpoint. P95 is the ninety-fifth percentile, calculated with linear interpolation between sorted samples.
1% Low FPS converts the mean of the slowest one percent of valid intervals to FPS, rounding the tail count upward. It requires one hundred intervals; otherwise it reads N/A. A poor tail beside a good average can reveal occasional stalls. The chart uses approximately one-second buckets and retains the latest 120; pausing chart updates leaves collection running.
These requestAnimationFrame intervals measure observed presentation cadence, not pure GPU execution time. VSync often imposes a ceiling, and CPU scheduling also affects results. Initialization, warm-up and boundary-crossing intervals are excluded. Slow valid frames remain included. Invalid intervals, gaps of at least two seconds, or four consecutive intervals above 250 ms terminate the run with a partial result. No GPU-time reading or stability score is invented.
Standard Benchmark vs Explore Mode
Standard Benchmark locks 640 × 360 pixels, eight kernel iterations, ninety-six maximum ray steps and a 0.8 step scale. After three seconds of warm-up, it measures thirty seconds. Phones and desktops use the same scene and resolution. Unsupported devices fail clearly instead of silently receiving a smaller standard workload.
Comparable results require completion and one hundred valid intervals. Match workload fpstester-mandelbulb 1.0.0, shader mandelbulb-glsl-1.0.0, protocol volume-presentation-1.0.0, backend and browser conditions. Explore allows up to fifteen minutes on desktop. A 120,000-interval storage cap ends unusually high-cadence sessions; partial exports remain useful observations without being labeled completed Standard benchmarks.
The rotating Explore workload uses version 1.1.0, shader mandelbulb-orbit-glsl-1.1.0 and protocol volume-explore-1.1.0. Its exports include initial and final view, rotation speed and a bounded camera-control history. Those samples describe changing views, while Standard keeps its original versions and disables rotation and dragging.
Why Results Differ Between Browsers and Devices
Record browser version, display refresh setting and power mode alongside your exports. Keep the viewport unchanged and close unrelated demanding applications. Repeat several runs under similar conditions before attributing small differences to hardware. Refresh-limited results can conceal additional rendering capacity.
Battery operation, driver compilation and competing activity can change cadence; this page cannot identify the cause. Compare actual pixel dimensions, especially in Explore where device caps and viewport geometry vary. Standard fixes resolution but cannot remove differences in operating-system scheduling or browser behavior.
Volume Shader BM vs GPU Stress Test
Choose the GPU stress test for general adjustable shader loading and longer stability observations using its separate presets and benchmark procedure. Choose Volume Shader BM for a Mandelbulb GPU benchmark with explicit fractal iterations, ray-march bounds and one fixed configuration. Their workloads differ, so their FPS figures cannot rank one another on a shared scale.
For lighter cadence inspection, open the frame time test. Use the 1% low FPS test to investigate slow-interval summaries, or read the measurement methodology for broader timing boundaries.
Browser Support, Privacy and Limitations
This volume shader benchmark needs JavaScript and functioning WebGL 2. WebGPU is not implemented; its option is disabled. Blocked graphics acceleration or shader compilation failures produce an error instead of a fake counter. Phones can use conservative presets. Stop if the device becomes uncomfortable to use; already submitted graphics work cannot be recalled.
Rendering, sampling and exports stay on your device. JSON and CSV contain schema version, timestamps, locale, browser family/version, effective settings, warnings, summary and bounded interval history. No result upload, GPU model query or account is used. Displayed figures round to two decimals; downloads preserve precision. This tool cannot measure temperature, wattage, utilization, VRAM, hardware health or native-game performance, or guarantee driver responsiveness.
Frequently asked questions
Is Volume Shader BM free, and do I need a download?
It is free to run here. No application installation or account is required; a browser with JavaScript and WebGL 2 is enough.
Is higher FPS always better?
Higher observed FPS is useful with matching workloads and conditions. Equal FPS near a refresh ceiling does not prove equal GPU throughput. Compare frame-time percentiles too.
Why is my result capped near 60 or 120 FPS?
Browsers usually schedule animation callbacks around display cadence. A VSync ceiling can remain even when the shader finishes sooner. This tool does not bypass it.
Can Volume Shader BM show GPU temperature?
No. Browser frame timing provides no temperature reading. A slow frame alone cannot identify overheating or certify a hardware fault.
Can I compare phone and desktop results?
Completed Standard runs use the same 640 × 360 workload. Match versions and conditions while accounting for different refresh ceilings. Explore dimensions may differ.
Are scores identical to other Volume Shader BM websites?
No shared score is claimed. This original shader has its own versioned protocol. Exported FPS and frame intervals describe this workload only.